Source Regions
A plugin for Alakazam
Tools > 4. Frequency and Component Analysis > Source Regions · averaged → averaged, one channel per brain region · SourceRegions
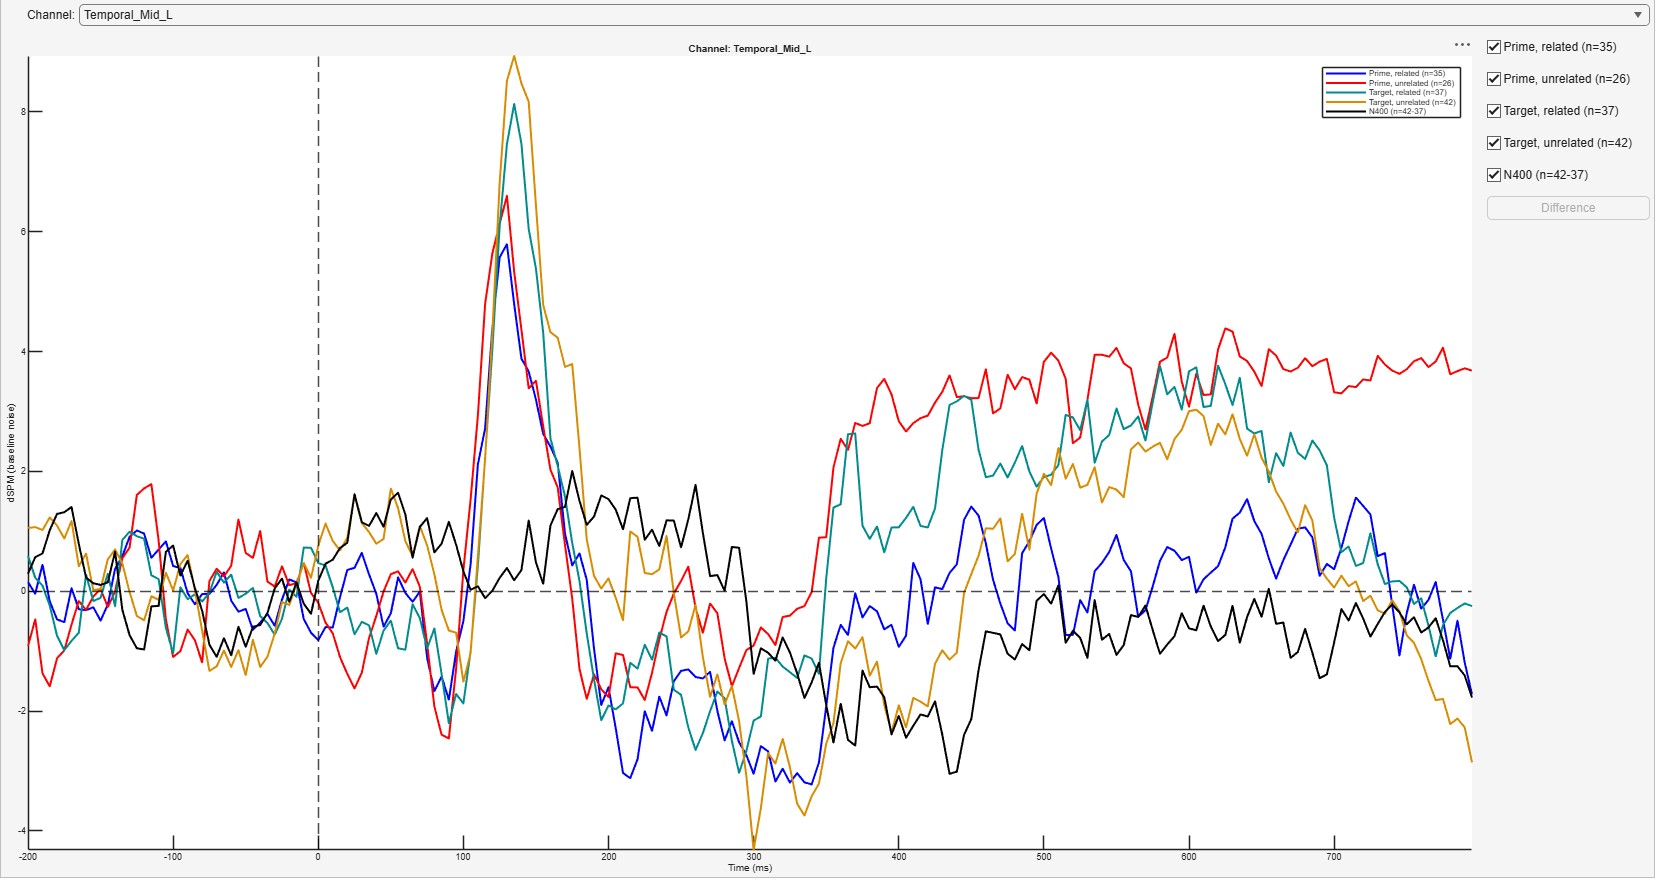
The time course of every region of an atlas: each bin is inverted onto the template cortex exactly as Source Estimate does, with the same settings and noise covariance, and the vertices of each region are averaged by FieldTrip’s ft_sourceparcellate. The atlas is one FieldTrip ships, AAL (Tzourio-Mazoyer et al. 2002) or Brainnetome (Fan et al. 2016). The result is an averaged dataset whose channels are regions, so the ERP plot, ERP Measure, grand averages, the statistics reports and TimeFrequency all read it as they read electrodes; its amplitude axis is the estimate’s scale, not microvolts.
Source Regions runs Source Estimate, which is a plugin of its own (AlakazamSourceEstimate): install both with Install plugins. Without it, Source Regions says so before its dialog opens.
| Option | Default | Meaning |
|---|---|---|
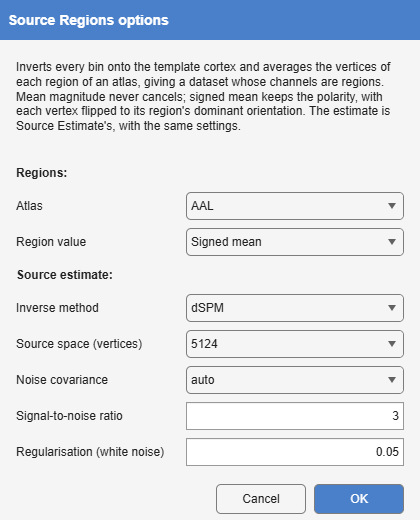
| Atlas | AAL | The regions: AAL’s or Brainnetome’s, mapped onto the cortical sheet in MNI space by FieldTrip’s ft_sourceinterpolate (nearest neighbour). A vertex in no region takes no part. |
| Region value | Mean magnitude | Mean magnitude: the mean of the vertices’ magnitudes, always positive. Signed mean: the mean along the cortical normal, each vertex first turned to its region’s dominant orientation, so the two banks of a sulcus do not cancel and an ERP’s polarity survives (MNE’s mean_flip). |
| Inverse method | dSPM | As in Source Estimate, a plugin of its own. |
| Source space | 20 484 vertices | As in Source Estimate. |
| Noise covariance | auto | auto uses the baseline covariance when the dataset has one (The noise covariance). |
| Signal-to-noise ratio, Regularisation | 3, 0.05 | As in Source Estimate. |
A region is only as distinct as the estimate under it. With a template head and a few dozen electrodes, neighbouring regions share much of their signal (Source estimation), so an effect larger in one region than in the next is weak evidence that it is located there and not there.